Blog Layout

Short-Term Improvements vs. Major Trend of Rates

Alan Fine • March 11, 2025

Short-Term Improvements vs. Major Trend of Rates

In mid-January 2025, highs were reached in interest rate markets as 10-year note yields peaked at 4.77%, and mortgage rates followed suit at 7.25%.

There has been much uncertainty in the market, generated by Trump’s implementation of tariffs; Department of Government Efficiency cuts to government employment and agencies; and questionable threats to our friendly country relationships with Canada, Mexico, and Ukraine. The stock market gave back earlier gains for the year, and investors sought safety by moving into the Treasury and mortgage markets, which caused this easing phase of interest rates by the first of March 2025. The 10-year note yield (rate) dropped to 4.20%, and the 30-year mortgage rate hit 6.70%.

Technical View

Charts are useful tools for technical analysis when analyzing markets because they create a picture summarizing all the world factors and events influencing values. See the chart below.
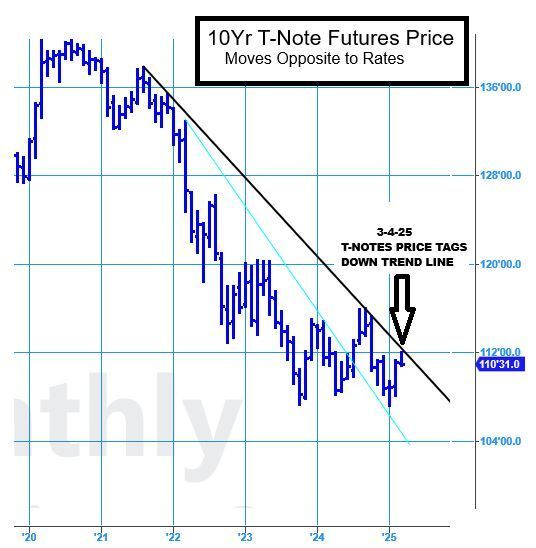
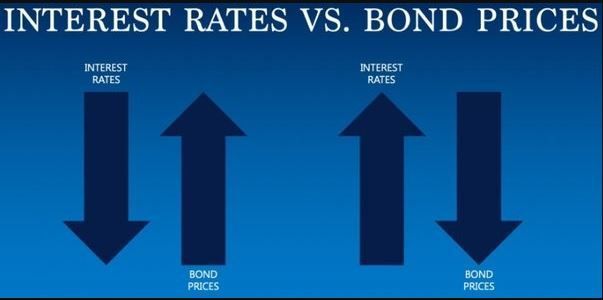
The 10-year T-note futures price chart shows that T-note prices move inversely to rates. The note values have risen to test a significant price downtrend in place for over three years. The chart indicates that note prices tested the downtrend and failed to break through. This is an indication that the downtrend remains intact, meaning interest rates are still in a long-term uptrend. A key technical rule is that trends persist until proven otherwise.


Summary

The 10-year T-note price chart remains in a downtrend, translating to higher yields and interest rates.
Trumping the Fed & Interest Rates
By Alan Fine February 25, 2025
The Fed only directly controls short-term interest rates. The borrowing costs that matter most for consumers are medium and long-term interest rates. These rates are set in global bond markets by traders who are betting on countless factors, including how high and volatile inflation will turn out to be, the strength of growth and investment, and how much debt the U.S. government issues — and in turn how the Fed will react to all of that.
Flight to Insecurity in the Face of a Fed Rate Cut
By Alan Fine August 3, 2024
Though the initial market reaction of economic fears to falling global stock prices, fooled investors buying Treasury and easing rates to their recent lows occurring before the Fed Rate Cut. This is where the technical indicators show their value they indicated bottoming of rates. Since the Fed Cut, the Mortgage & Treasury Rates (Yields) shot significantly higher.
Behind the Debt Ceiling
By Alan Fine July 29, 2023
Debt Ceiling and Interest Payments: The ongoing debt ceiling faceoff highlights the underlying issues of US national debt growth and the acceleration of interest costs. The high US Debt is a major inflation factor that lead to high interest rates.
10Yr Treasury Note Analysis A Technical Case for Higher Rates
By Alan Fine January 21, 2023
The 10Yr Note, is the benchmark instrument that is analyzed by technical tools. These tools charts & indicators provide an objective and consistent view of the major trend of rates.
Market Review After Peak Correction
By Alan Fine August 12, 2022
Market Review after a Peak Correction
Mortgage Rates Move Ahead of Fed
By Alan Fine May 10, 2022
Brief review of mortgage rates moving sharply higher before any Fed Funds changes.
Bonds Dictate the Trend of Interest Rates
By Alan Fine February 12, 2022
This discusses the upward movements that occurred in the Bond & Mortgage rates prompted by rising inflation seen by the sharp increase in the Consumer Price Index that well exceeded the Fed’s target inflation rate of 2.0%. It is a myth the Fed has ultimate control of consumer & investors interest rates.
The End of Easy Money the Fed's Policy Shift
By Alan Fine November 27, 2021
An insightful overview that early identified a major up trend of interest rates months before the Fed made their first increase in the Fed Funds Rate. The Past 13 yrs of easy money policy ending, and new cycle to follow is an uptrend for interest rates. Note Mortgage Rates were 3.10% when written.
The End of Easy Money
January 2, 2021
This is a reprint from May 1995 as it discussing a time in history when the Fed was cutting rates and the Market Rates of Bonds moved higher. This divergence of Higher Treasury & Mortgage Rates occurred on the Sept 22024 Fed Cut It's helpful to know a little history as it can repeat itself.
Anatomy of a Cycle Low in Interest Rates
By Alan Fine June 14, 2019
This Article is a reprint that was published in “Mortgage Originator” magazine. A sophisticated description of market timing cycles and full range of technical indicators.
Interest Rates and Charts
By Alan Fine June 13, 2019
If you want to know where inter­ est rates are going, you've got lots of options. There are the technicians or self-described "chartists" who will tell you that if you just look at some plotted points on a graph you will see the future course of rates.
More Posts
Share by: