Ask a Loan Advisor
Flight to Insecurity in the Face of a Fed Rate Cut
Flight to Insecurity in the Face of a Fed Rate Cut
A False Sense of Security
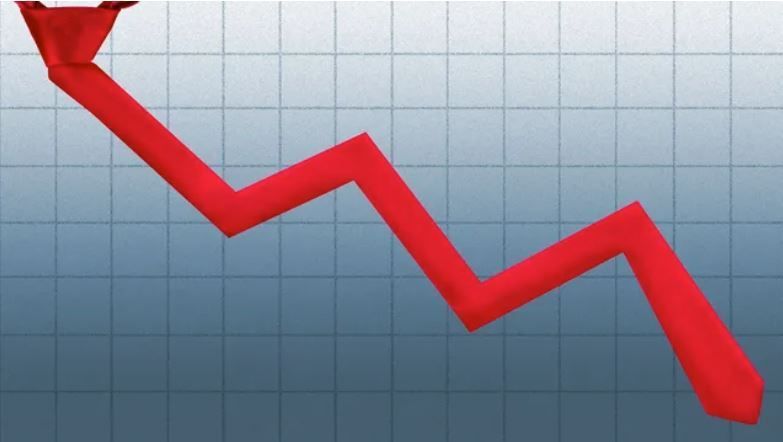
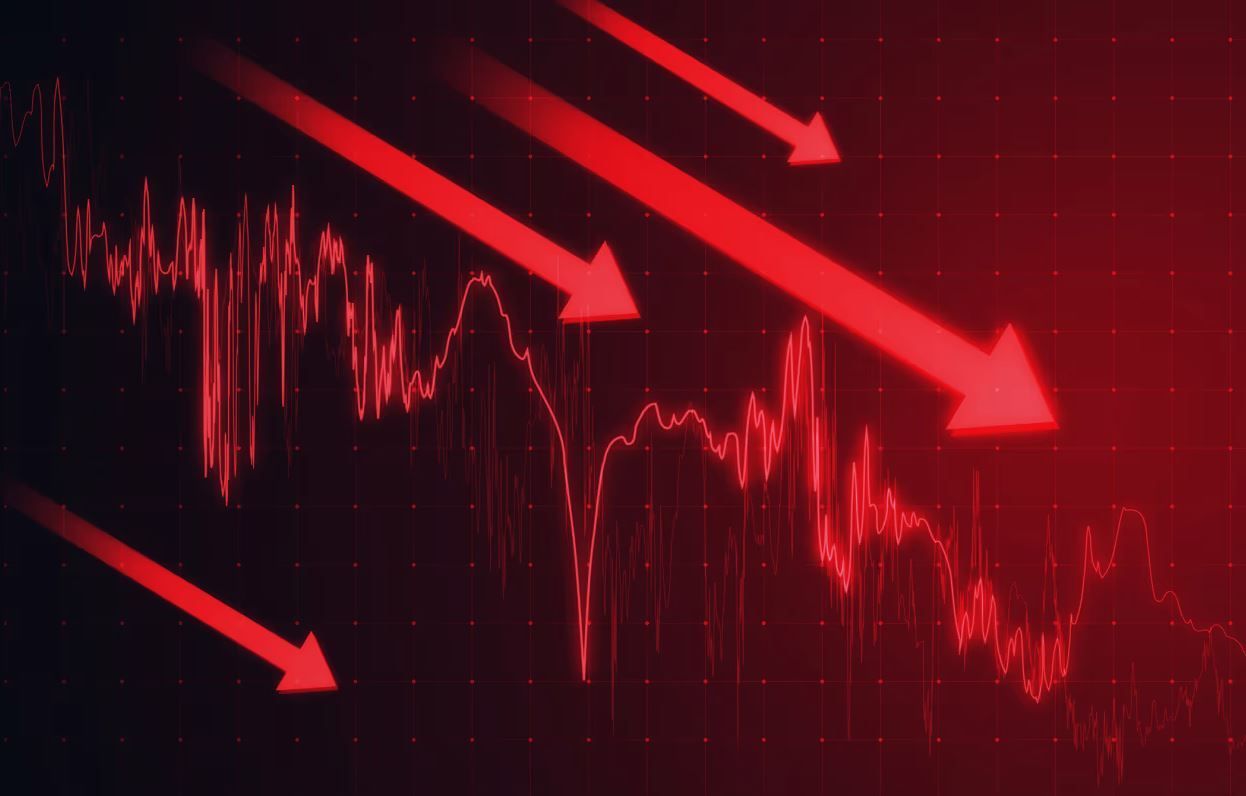
At the start of August, a series of negative economic reports led to a sharp downturn in stock prices, resulting in a temporary shift of funds towards the Treasury and debt markets. On August 2, the employment report for July revealed a surprising drop in the number of jobs in the US: 114,000 instead of the anticipated 185,000. Furthermore, a downturn in global stock markets, primarily influenced by the fall of the Japanese currency and equity markets, prompted investors to move their capital from stocks into Treasuries. This phenomenon is termed a "flight to safety," as US Treasuries are traditionally regarded as a secure refuge during times of fear and uncertainty. However, the influx of funds into Treasuries, which pushed prices to new annual highs while driving yields to new lows, proved to be short-lived. The yields on the benchmark 10-year T-Note (Treasury note) soon reverted to their previous trading range after hitting a new low of 3.67% for the year. The 10-year T-note largely overlooked subsequent declines in the stock market and did not react to the flight to safety in the expected manner typical of a normal market scenario.
Fundamental Factors Weigh on the Treasury and Debt Markets
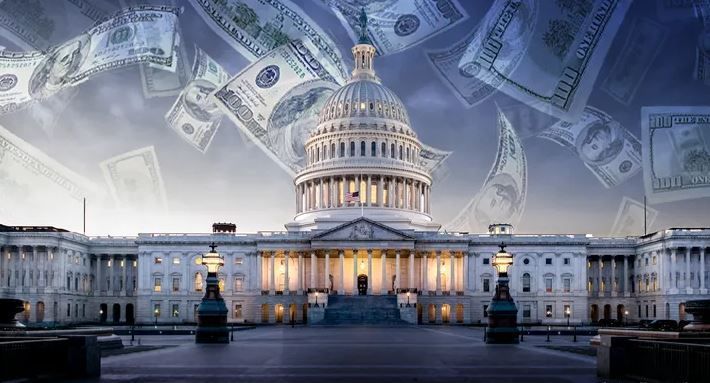
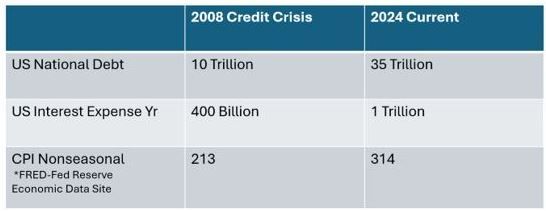
Market fundamental factors are spiraling out of control due to the ongoing surge of the US national debt, now at an alarming 35 trillion. The annual interest expense on this debt has reached 1 trillion, compounded by the soaring cost of living driven by inflation, which together undermines the perception of Treasuries as a Safe Haven. See the chart below.
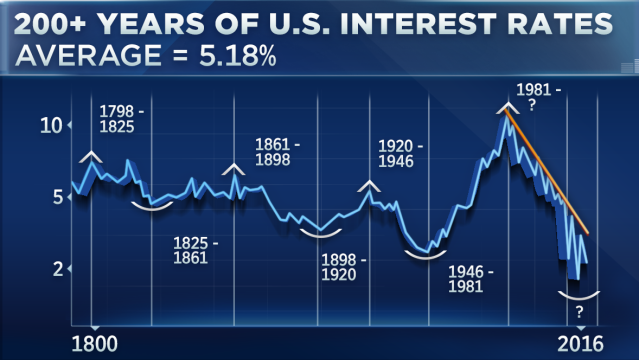
Inflation and Debt Effects on Interest Rates
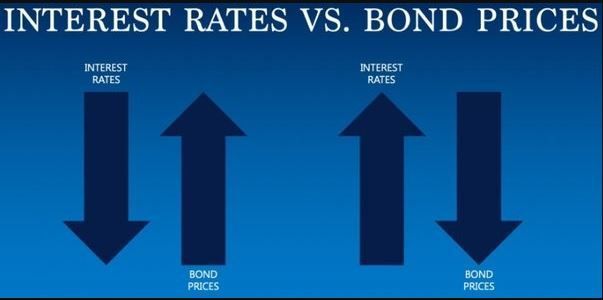
The rising levels of debt necessitate the sale of additional Treasuries by the US Treasury Department, leading to an increased market supply. A larger supply generally results in lower prices. As Treasuries prices decrease, their yields or interest rates rise. Inflation, better illustrated by the nonseasonal CPI reports, has risen from 2008 to 2024, reflecting an annual increase in consumer prices of 6.25%. This data can be found on the FRED (Federal Reserve Economic Data) website. In contrast, this report offers a markedly different viewpoint than the seasonal Consumer Price Index (CPI), which communicates monthly fluctuations and reports to the public with minor tenths of percentage changes.
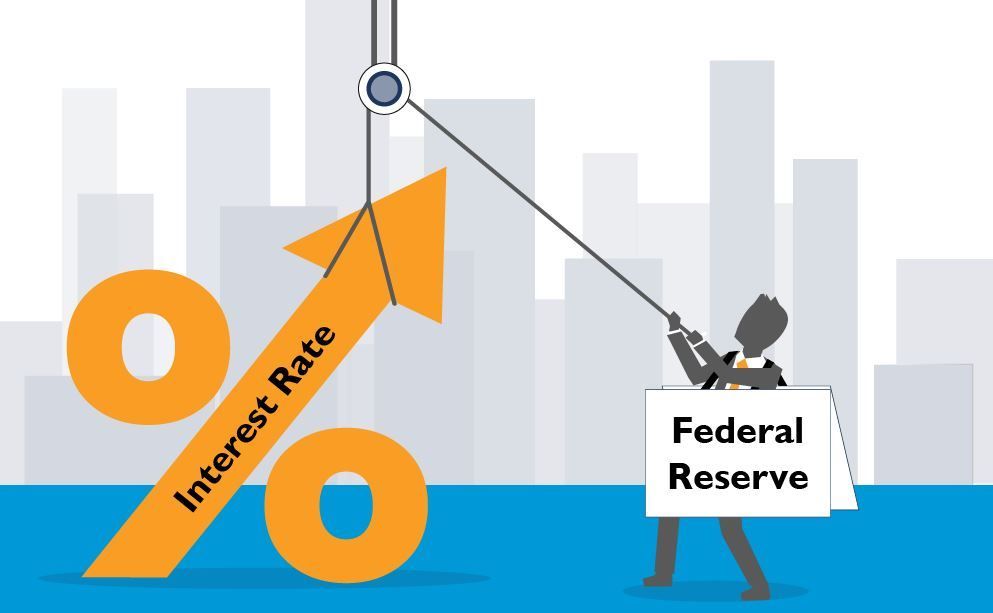
Fed News
On August 23, Fed Chairman Powell announced a policy shift to implement rate cuts in September. However, the response in the Treasury market was subdued, as participants had already factored in this possibility. This expectation was reflected in the Fed Fund's monitor tool, which indicated a 73% likelihood of a 0.25% cut for September even before Powell's announcement.
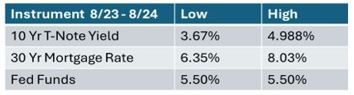
Markets, including the 10-year T-Note and 30-year mortgage rates, have progressed significantly ahead of the Fed Funds Rate. The 10-year yield and mortgage rates reached their yearly lows in early August 2024 and have notably distanced themselves from their peak levels. Meanwhile, the Fed Funds Rate remains elevated (unchanged) since July 26, 2023, when it stood at 5.25%. Below, you can find the details of the highs and lows of these rates and yields.
Summary
The 10-year T-Note is not responding as expected in a low-interest rate environment, particularly amidst negative economic News and declining stock prices. It failed to maintain its new yield lows following the announcement of a pending Fed policy shift, with a rate cut anticipated in September. The underlying issues of the national US debt and the cost of carrying that debt, coupled with the long-term inflation outlook, adversely impact prices in both the Treasury and mortgage markets.
Technical and fundamental elements influencing market behavior indicate that yields and rates are entering a bottoming phase. Refer to the T-Note Futures Price Chart (below), which has risen to meet a long-term downtrend line as T-Note yields recorded a new yearly low. Now, yields and rates have increased from their lowest levels of the year.