Ask a Loan Advisor
Behind the Debt Ceiling
Behind the Debt Ceiling
Whatever transpires from the debt ceiling faceoff between the White House and GOP may only be the symptom of the more significant underlying issues of US national debt growth and acceleration of interest cost to our country.
Review of National Debt & US Interest Payments
The 2008 benchmark time frame can be used when the credit crisis collapsed the US economy and prompted the US Federal Reserve to implement a quantitative easing money plan, which then the Fed purchased assets. This accounting for the Fed assets is termed the Fed Balance sheet. The national debt in the 2008 period was at 10.7 trillion. The Fed balance sheet has grown as high as 9 trillion since then and remains high today at 8.5 trillion, which is approximately 80% of the national debt when the Fed Balance Sheet started. Today's US national debt is at 31.8 trillion, which has nearly tripled since 2008. The interest payment on current government expenditures is 928 billion, up over 50% since 1st quarter of 2022, then at 603 billion. See chart Interest Payments.
Federal Government Current Expenditures: Interest Payments 18(81.8%)

Technical Aspects
US interest payments on government expenditures are in an upward parabolic formation, a sharp upward direction that translates to a faster pace of US debt growth.
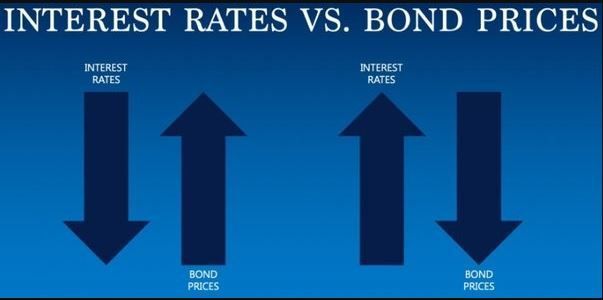
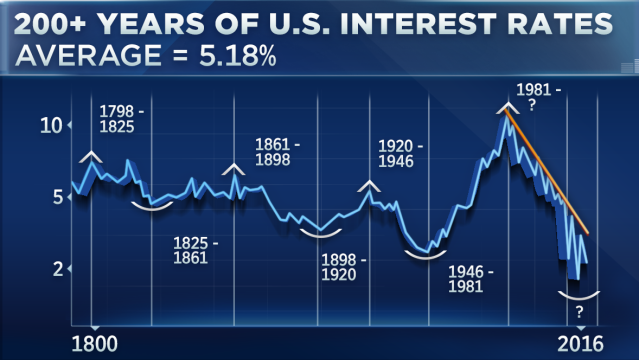
Treasury note prices have remained in a long-term downtrend, upward for yields/rates. Even as the 10-year note yields corrected from over 4.00% to 3.25%, the 10-year Note held its downtrend price pattern (upward yields).
Conclusion
Chart formations for the 10-year Note have remained bearish, and since the trend is a continuum until change continues to define rates upward. The underlying factors behind the debt ceiling will contribute to more significant US national debt, and growing interest expense is inflationary, which contributes to a higher interest rate environment.
