(858) 755-0575
Ask a Loan Advisor
Blog Layout
Anatomy of a Cycle Low in Interest Rates
Alan Fine • June 14, 2019
Anatomy of a Cycle Low in Interest Rates
by Alan M. Fine and Glen Katz
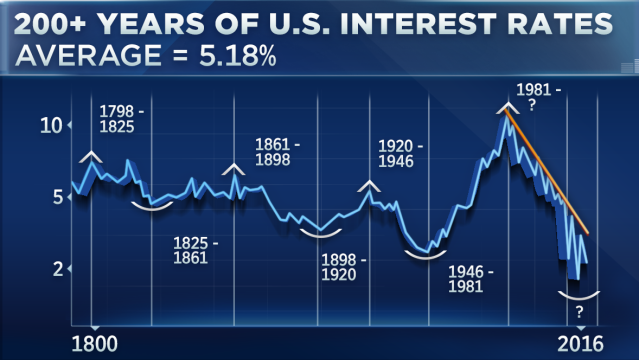
Treasury bond yields are one of the most closely watched financial statistics. Changes in interest rates are felt widespread and influence everything from Federal Reserve policy to the average home buyer's decision. These reactions in turn affect interest rates in an endless circle of cause and effect. Making sense of these complicated economic relationships through a fundamental analysis (the study of raw economic data to forecast price) and how they impact rates can be confusing.
I Our approach to market forecasting emphasizes the study of price action which involves technical analysis (the study of market action through the use of charts and mathematical equations). By understanding the movement of prices in the bond market, we can expect to get a clearer picture of future interest rate direction. A study of there cent cycle low in bond prices will show you what to look for to identify future turning points in the interest rate cycle. To accomplish this we will focus our analysis on the 30-year U.S. Treasury Bond and evaluate the market in terms of 1. Fundamentals, 2. Cycle periods, 3. Major and minor trends, 4. Technical indicators, and 5. Chart patterns. We selected the month of May to evaluate; it was significant because bonds bottomed, which means interest rates peaked, and two weeks later inflation started to rise.
Bond traders follow fundamentals from monetary indicators to economic statistics for clues to one thing-inflation. Inflation is the biggest fear of traders as well as the cornerstone of Federal Reserve policy and the outlook recently has been negative for bonds. On May 23 the Commodity Research
Bureau Index (CRB) rose to a 3 1/2 year high and was viewed as a signal of rising inflation. This measure of commodity prices was alarming because it was so broad-based, with strength coming from grains, metals, crude oil and coffee. The other area of major concern is the recent slide in the U.S. dollar. In the past, a falling U.S. dollar has often resulted in a tighter money policy by the Fed. The failure of the U.S. dollar to rally despite Fed intervention on June 24 may leave the Fed no alternative but to raise interest rates. Strong business loan demand and high employment have added to the bearish sentiment in the bond market.
Markets move up and down, forming tops and bottoms. Being able to fit these highs and lows within a defined time period is called a cycle. Because cycles are repetitive, they imply a certain predictability. This allows you to project the time frame when cycle tops and bottoms are due to occur. We have identified an approximate three month cycle in interest rates over the past few years. With the last significant turning point in early February, our cycle indicated that we were moving into a time frame for a potential low in terms of bond prices at the beginning of May. The actual low was made on May 11, representing a probable high in interest/mortgage rates.
As the cycle time frame became favorable, the minor and intermediate trends were down, suggesting the next impending mo,·e would be neutral to up. A look at the major trend based on the monthly charts revealed the most interesting picture. A trend-line drawn from the lows in July, 1984 to the lows of September, 1990, came right in to the lows in May, 1994. As long as prices remain above this 10-year trend-line, the major trend is still considered to be up. The fact that bond prices came right to the major trend-line and held is an important chart event that should be watched closely. Currently, the minor and intermediate trends are neutral as bond prices have basically moved sideways for the last three months. To better gauge market trends, oscillators (technical measuring tool measuring momentum and strength that signal extremes of selling or buying) add another dimension by determining if markets are overbought or oversold by measuring momentum and looking for divergence. A divergence occurs when the price and the oscillator move in opposite directions. As bond prices declined in May, momentum oscillators revealed they were severely oversold, and along with the formation of a bullish divergence, warned of an impending move up. Our Market Characteristic oscillator links sentiment with price action by observing how the market responds to news events and reports. For example, the recent highs in the CRB index occurred after the cycle low in bond prices on May 11.
Chart patterns are pictures or formations that can be classified as reversals or continuations, each with their own set of rules and implications. No observable pattern was apparent until the last week in May when a potential head and shoulder formation developed. This is a common reversal pattern and considered to be one of the more reliable ones. A buy signal is indicated by a close over 105 3/4 (September bond futures) and suggests a potential price objective around 110 1/4 corresponding to a cash yield of approximately 6.9 percent and a 30-year fixed mortgage rate of 7 7/8. This scenario is valid as long as prices remain above the cycle low.
All of our indicators lined up to suggest a potential reversal of prices in May. Cycles told us the time was right. Oscillators said the tendency was strong. Market Characteristic showed us the divergence between price action and fundamentals, adding truth to the statement that markets bottom on bad news. Trend analysis revealed the major trend is still up as prices held above the 10- year trend-line. A breakout of the head and shoulders formation will show this cycle low may be a trend change.
Based on the May cycle, our analysis now favors stable to lower interest rates through mid-August, as the recent downward trend in bond prices developed into a sideways neutral move. Watching the 10-year trend-line and the head and shoulders formation in the bond market may be the key to the next major move in mortgage rates.
ALAN M. FINE
is director of Real Source Interest Rate Advisory, San Diego, CA.
GLEN KATZ
is market analyst at Real Source Interest Rate Advisory, San Diego, CA.
By Alan Fine
•
March 11, 2025
The stock market gave back earlier gains for the year, and investors sought safety by moving into the Treasury and mortgage markets, which caused this easing phase of interest rates by the first of March 2025. The 10-year note yield (rate) dropped to 4.20%, and the 30-year mortgage rate hit 6.70%.
By Alan Fine
•
February 25, 2025
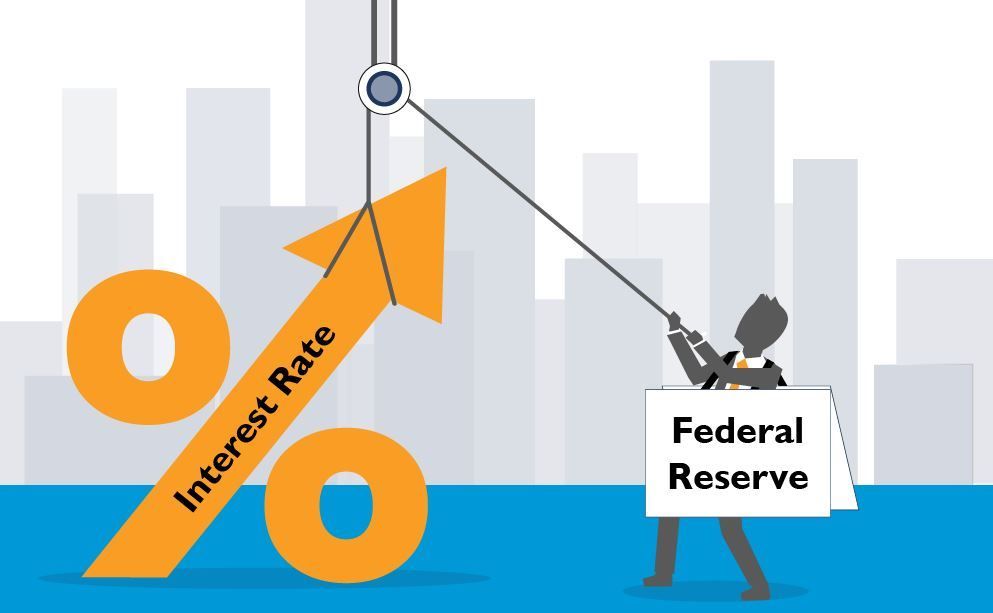
The Fed only directly controls short-term interest rates. The borrowing costs that matter most for consumers are medium and long-term interest rates. These rates are set in global bond markets by traders who are betting on countless factors, including how high and volatile inflation will turn out to be, the strength of growth and investment, and how much debt the U.S. government issues — and in turn how the Fed will react to all of that.
By Alan Fine
•
August 3, 2024
Though the initial market reaction of economic fears to falling global stock prices, fooled investors buying Treasury and easing rates to their recent lows occurring before the Fed Rate Cut. This is where the technical indicators show their value they indicated bottoming of rates. Since the Fed Cut, the Mortgage & Treasury Rates (Yields) shot significantly higher.
By Alan Fine
•
February 12, 2022
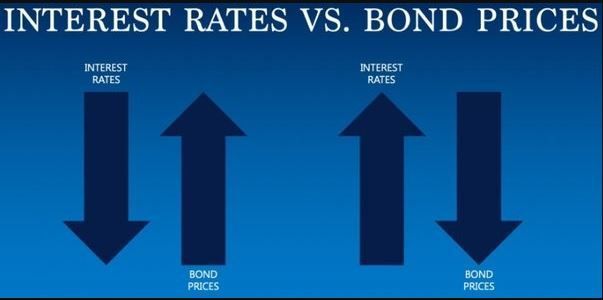
This discusses the upward movements that occurred in the Bond & Mortgage rates prompted by rising inflation seen by the sharp increase in the Consumer Price Index that well exceeded the Fed’s target inflation rate of 2.0%. It is a myth the Fed has ultimate control of consumer & investors interest rates.

By Alan Fine
•
November 27, 2021
An insightful overview that early identified a major up trend of interest rates months before the Fed made their first increase in the Fed Funds Rate. The Past 13 yrs of easy money policy ending, and new cycle to follow is an uptrend for interest rates. Note Mortgage Rates were 3.10% when written.
January 2, 2021
This is a reprint from May 1995 as it discussing a time in history when the Fed was cutting rates and the Market Rates of Bonds moved higher. This divergence of Higher Treasury & Mortgage Rates occurred on the Sept 22024 Fed Cut It's helpful to know a little history as it can repeat itself.

