(858) 755-0575
Ask a Loan Advisor
Blog Layout
Interest Rates and Charts
Alan Fine • June 13, 2019
Interest Rates and Charts
If you want to know where interest rates are going, you've got lots of options. There are the technicians or self-described "chartists" who will tell you that if you just look at some plotted points on a graph you will see the future course of rates.
We tried our hand with one of these folks, but for safekeeping, we also consulted a true expert on Fed policy. Former Federal Reserve Board Governor Lyle Gramley, now a consulting economist with the Mortgage Bankers Association of America, says that rates for the next year or so willstay fairly dose to where they are now, with a slight bias in an upward direction. Gramley is telling mortgage bankers that they have at least one more year of good business "between now and the middle of 1994;' but after that, it gets more difficult to predict. The ex-Fed governor says that "a year from now, we may have to think about inflation getting worse and the Fed may have to tighten monetary policy, unless we get some substantial action on the deficit. And although we can't rule that out right now, we certainly can't count on it."
Gramley says that from observing what's been going on in Washington, D.C. recently, serious action on the deficit is just not a sure bet for budget years beyond FY 1994. This uncertainty as perceived by the market is what helped boost long bond rates above the 7 percent mark in May. Gramley says two things "bothered the bond market" enough to jack up the 30-year Treasury rate. He says the first was worries about worsening inflation and the second was "worries that the Clinton administration is out of touch with reality!' And even though the price of gold hit a two-year high on May 18, according to The New York Times, implying investor concerns about inflation, Gramley says that "nothing is showing up badly" as far as numbers suggesting a real upturn in inflation. But Gramley said "gold bugs are like chartist.r-theylike to worry:' Even so, he says, the other side of the
coin is "there isn't a shred of evidence that inflation is improving this year." Gramley said that there was "still some hope at the beginning of the year [that inflation was showing further improvement], but the numbers that came in for the first four months of the year ruled out that hope!'
This year the producer price index for finished goods (excluding food and energy) has been running around 2 per cent or a little less on a year-over-year basis. Measured similarly, consumer prices have been up at about 3.25 to 3.5 percent Gramley says that an even more fundamental indicator of inflation is compensation per worker and those numbers also appear tame. The economist says that inflation will worsen when costs turn up. But price increases merely to widen corporate profit mar gins are being kept in check by a very competitive world economy.
Gramley says, apart from worsening inflation, signs of a quickening pace of economic growth are the other key fac tor that would prompt a rise in interest rates. But prior to the release of revised first-quarter GDP figures, Gramley pre dicted a revision in the number that would take the quarter's growth rate "down below 1 percent:' He said that he is "not pessimistic about the economy" even though the first quarter's showing was clearly pretty dismal. Even so, Gramley contends that "this economy is not falling on its face."
We will see better growth in the second quarter, he predicts, but "not growth that is fast enough to start worrying about inflation getting worse." To illustrate his point that there is substantial slack in the economy before inflationary pressures could start doing real damage, particularly in terms of wage hikes, Gramley points to recent employment gains. "Normal" job gains, by historical standards, are in the range of
300,000 a month during a recovery. Gramley says that during the third quarter of 1992 the monthly average gain was 25,000. The fourth quarter 1992 improved to 80,000 per month and the first four months of 1993 aver aged 133,000 per month.
Moving now to the subject of charts and what their power to portend, the ever-lucid Gramley says this: "I like charts that illustrate points. I don't like charts that give you magic answers." But charts to a chartist take on far grander meaning. Alan Fine, market specialist and originator with Real Source, a mortgage brokerage firm in La Jolla, California, is just such a self-described "technician" who has been tracking bonds for 10 years. He says the tools of the trade he learned in trading commodities and selling mortgage securities to private investors have helped him perfect the ability to track bond market turning points.
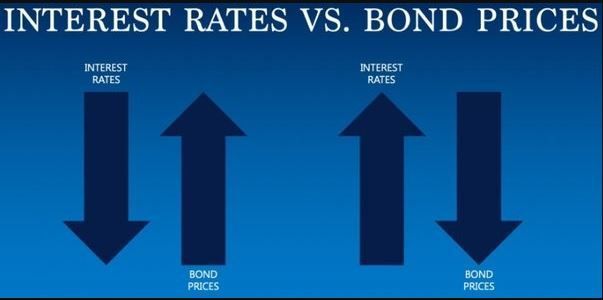
Take last March, for instance. Fine says the bond market hit a high (in terms of prices for 30-year T-bonds) on March 4. On March 14, he says, the market "retested the high of 113." That point on the charts was never exceeded, he says. Then he describes what goes on in a chartist's head as they gaze over such a chart "What goes off in a technician's mind, because the market is failing to go any higher, is you've got chart points that show a double top. And since [the price of bonds] have an inverse relationship with mortgage rates, when bonds are high, then mortgage rates are at a low." Midanet pricing data from Freddie Mac showed March 8 as a trough for mortgage rates at 7.25 percent.
When Fine sees such a formation in bond market activity, he scrambles to convince his borrowers to lock. Because he works with fairly sophisticated borrowers in the high-rent district of La Jolla, his knowledge sometimes moves people to act rather than simply scratch Boardroom.
MORTGAGE BANKING - JUNE 1993
Boardroom View from page 11 their heads. He notes that the week of May 10, he convinced a borrower to lock by actually sending him a chart that showed the bond market had topped.
But the predictive ability of these charts in the grand murky middle of these cycles, which Fine says last between four and five months between topping and bottoming points, is far less impressive. Fine concedes that "yes, it's difficult to see a top." But recently, Fine says that May 14 was a "turning point in sentiment" in the bond market, after that point the bond market moved into an inflationary perspective. He says at that point, "bonds were forming a high-you could see it on the charts."
But Fine says "the formations of the market usually are more powerful than a flash of news. Charts take all the factors in the world and assimilate it. Charts give you a summary of what the forces that play on the [bond market] are. Charts give you a very big picture."
Whether you've got the religion or not is up to you. Fine says his charts tell him it would be a very prudent move as of May 25 to lock rather than float and to refinance out of ARMs into fixed rates if you plan to stay in your house. He says we could still see another eighth of a percent dip in mortgage rates while the market meanders in 1 "this gigantic range" in the middle of this new cycle.
Janet Reilley Hewitt
Editor in Chief
By Alan Fine
•
March 11, 2025
The stock market gave back earlier gains for the year, and investors sought safety by moving into the Treasury and mortgage markets, which caused this easing phase of interest rates by the first of March 2025. The 10-year note yield (rate) dropped to 4.20%, and the 30-year mortgage rate hit 6.70%.
By Alan Fine
•
February 25, 2025
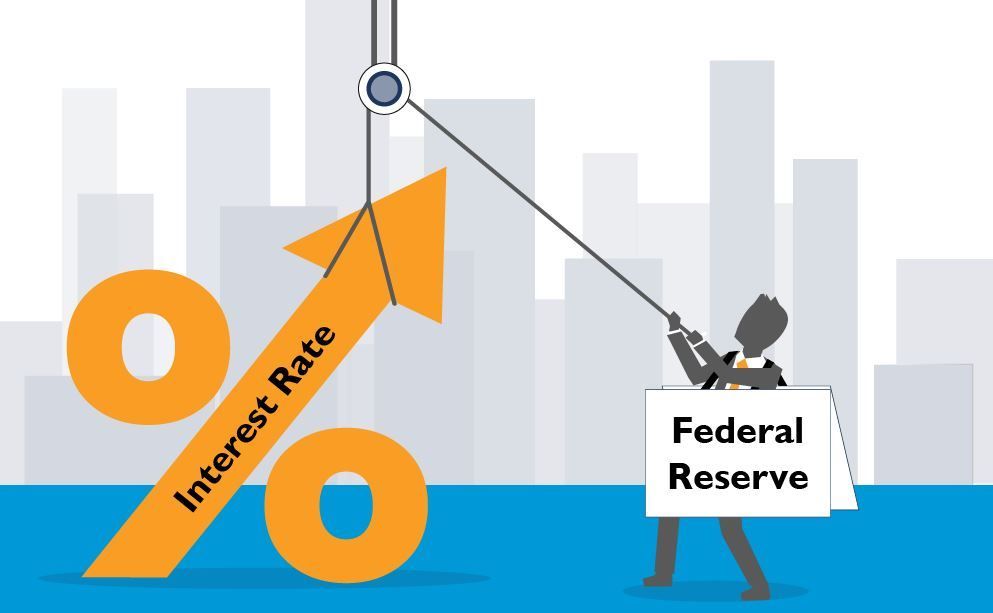
The Fed only directly controls short-term interest rates. The borrowing costs that matter most for consumers are medium and long-term interest rates. These rates are set in global bond markets by traders who are betting on countless factors, including how high and volatile inflation will turn out to be, the strength of growth and investment, and how much debt the U.S. government issues — and in turn how the Fed will react to all of that.
By Alan Fine
•
August 3, 2024
Though the initial market reaction of economic fears to falling global stock prices, fooled investors buying Treasury and easing rates to their recent lows occurring before the Fed Rate Cut. This is where the technical indicators show their value they indicated bottoming of rates. Since the Fed Cut, the Mortgage & Treasury Rates (Yields) shot significantly higher.
By Alan Fine
•
February 12, 2022
This discusses the upward movements that occurred in the Bond & Mortgage rates prompted by rising inflation seen by the sharp increase in the Consumer Price Index that well exceeded the Fed’s target inflation rate of 2.0%. It is a myth the Fed has ultimate control of consumer & investors interest rates.

By Alan Fine
•
November 27, 2021
An insightful overview that early identified a major up trend of interest rates months before the Fed made their first increase in the Fed Funds Rate. The Past 13 yrs of easy money policy ending, and new cycle to follow is an uptrend for interest rates. Note Mortgage Rates were 3.10% when written.
January 2, 2021
This is a reprint from May 1995 as it discussing a time in history when the Fed was cutting rates and the Market Rates of Bonds moved higher. This divergence of Higher Treasury & Mortgage Rates occurred on the Sept 22024 Fed Cut It's helpful to know a little history as it can repeat itself.

