Ask a Loan Advisor
10Yr Treasury Note Analysis A Technical Case for Higher Rates
10Yr Treasury Note Analysis A Technical Case for Higher Rates
Fundamental Factors
Interest rate markets have been in a correction (easing) phase since rates peaked in October 2022. Market corrections are adjustments to a significant upward trend. This interest rate correction was partly fueled by a decline in the Consumer Price Index (CPI) and Producer Price Index (PPI), thus reducing the current inflation outlook.
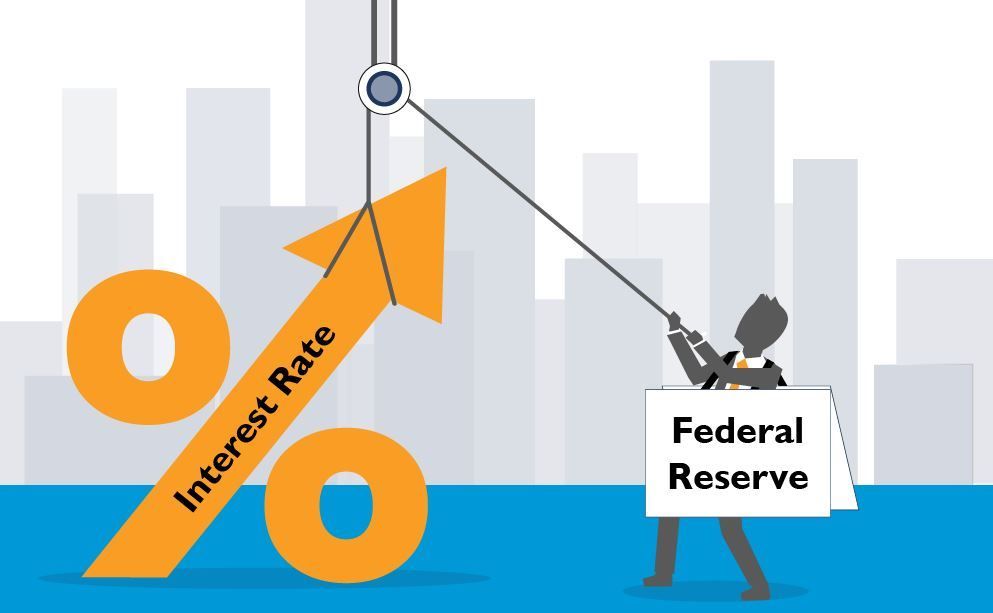
The CPI has declined over the last six months from monthly changes reported from June (1.9%) to December (-0.10%) of 2022. The CPI twelve-month unadjusted yearly average as of December 2022 is 6.5%, which is much higher than the Federal Reserve's inflation target rate of 2.00% and may explain Federal Reserve Chairman Jerome Powell's position to tighten rates further.
Debt Matters
Debt is also an essential element of inflation. The interest growth alone on the US national debt has skyrocketed in the fourth quarter of 2022, increasing to $213 billion, $63 billion higher than last year, as the national debt ceiling approaches $31.4 billion.
Technically Speaking Divergence
On January 19, 2023, a divergence occurred between the 10-year Treasury note (T-note) cash and futures markets. The 10-year T-note failed to reach a new low under 3.32%, while the futures prices recently reached new highs before falling. Divergences often signal major turning points in markets.
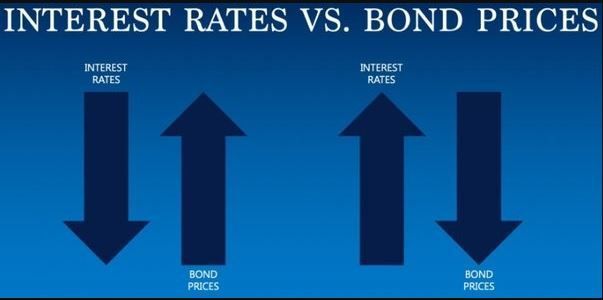
In this case, a negative divergence showed price weakness in the 10-year T-note, suggesting a bearish Treasury market or higher rates (yields) ahead.
Market Characteristics
On January 18, 2023, just one day before the 10-year T-note divergence signal, the PPI reported a lower-than-expected monthly change of -.5 %. The next day, the 10-year T-note prices rolled over and dropped to the price support. The yield resistance level of 3.55% broke through on February 6, 2023. In addition, this behavior occurred in the previous two CPI reports on December 13, 2022 (0.0 monthly change) and January 12, 2023 (-.01 monthly change). In other words, the 10-year T-note is not improving after lower inflation data, a negative sign for Treasury prices causing upward rates.
Intermediate-Term Cycle
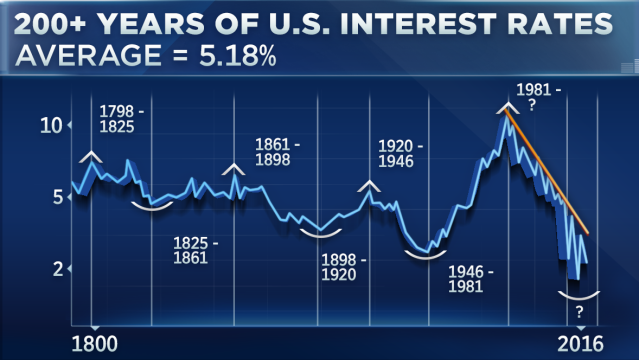
The 10-year T-Note has a 3-4 month (intermediate) term trend. Rates known as yields on the 10-year Note have been easing since October 21, 2022, with a peak Yield of 4.23%. From a market cycle timing perspective, the end of the easy phase of rates is completed between January 21 and February 21. This suggests that rates are in front of an uptrend for the next quarter, which aligns with the significant uptrend of interest rates defined by the 10-year T-Note monthly chart.
Summary
The Treasury market shows bearish signals because a divergence developed between the 10-year T-note cash and futures markets. Just prior to this divergence, negative market characteristics occurred after lower CPI and PPI readings. T-Note chart formations of yields failed to move under 3.22%, then shot up through the resistance to recent new highs of 3.69%. Technical indicators are aligning for the Treasury market to resume the significant up trend for rates.
